Auctions Insights
Reducing blind spots in ad auction failures
Ad performance issues were difficult to diagnose due to fragmented system outputs and limited visibility into auction behavior. This led to slow decision-making and missed opportunities for optimization.
I led the design of a new diagnostic experience that helped internal teams interpret complex auction signals, identify root causes faster, and take action with confidence.
Impact
Reduced time to diagnose auction issues
Improved visibility into system behavior across key dimensions
Enabled more consistent and confident decision-making across teams
Established a foundation for more proactive monitoring and optimization
Context
This work focused on improving how teams investigated and resolved issues in a high-volume ad auction system.
Role: Senior Product Designer
Scope: 0→1 product development, from problem definition to MVP launch
Partners: Product, Engineering, Technical Account Managers
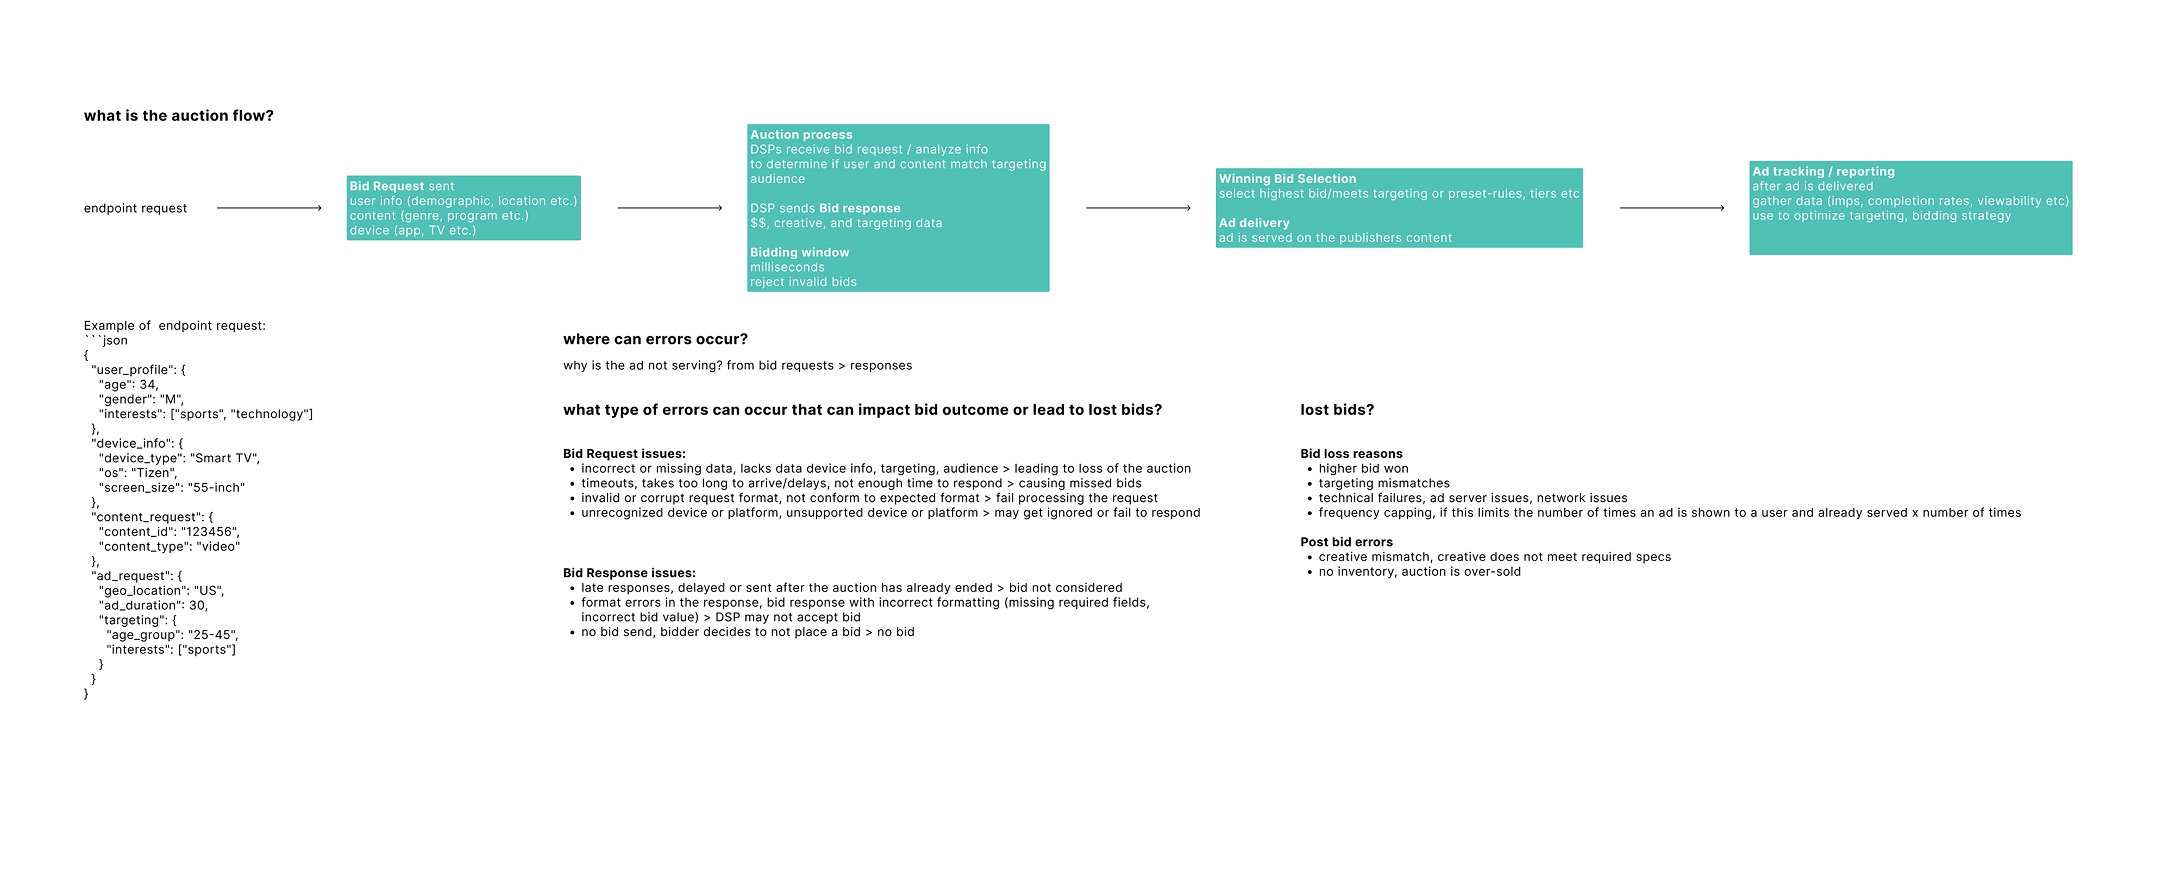
The problem
When ad performance dropped, teams struggled to understand why.
Data was fragmented across multiple tools and dashboards
Auction behavior was complex and difficult to interpret
There was no clear path from signal → diagnosis → action
As a result:
Investigations were slow and manual
Root causes were often unclear or misidentified
Decisions relied heavily on experience and guesswork
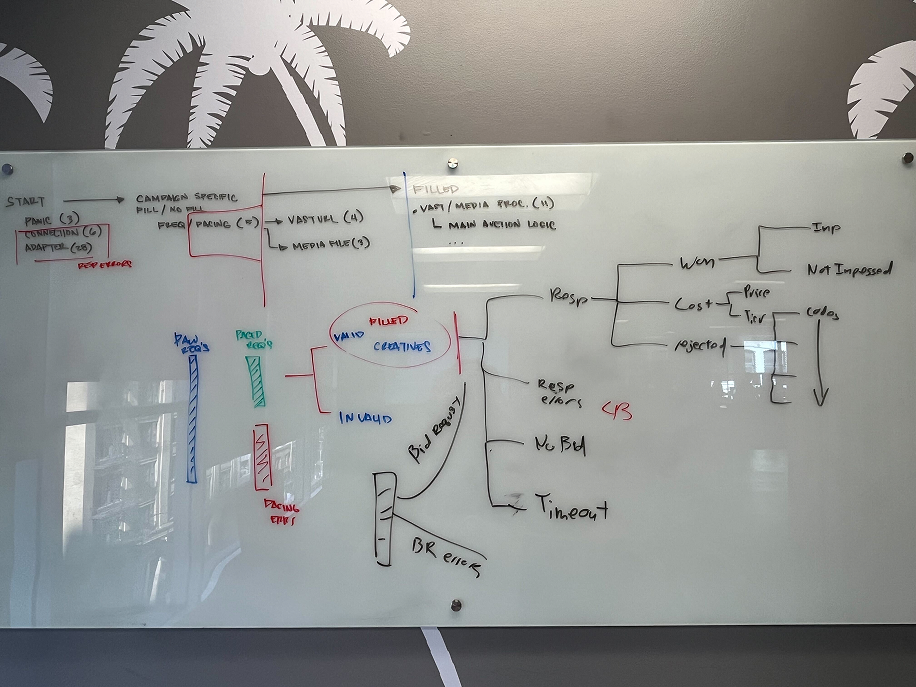
Why this was difficult
This wasn’t just a visibility problem—it was a sensemaking problem.
Signals were interdependent and context-sensitive
Root causes were not directly observable
Users needed to form and test hypotheses, not just view data
Different teams approached diagnosis inconsistently
Designing for this required supporting how people think, not just what they see.
Key product decisions
1.Focus on diagnosis, not just visibility
Instead of creating another dashboard, we designed for investigation workflows helping users move from signal to root cause.
2.Prioritize actionable signals over raw data
We surfaced the most relevant indicators and relationships, reducing cognitive load and avoiding data overload.
3.Support iterative exploration
Users needed to test hypotheses and refine their understanding. We designed flows that allowed for progressive investigation, not static views.
4.Standardize how teams interpret issues
We introduced shared structures and terminology to reduce reliance on tribal knowledge and improve consistency across teams.
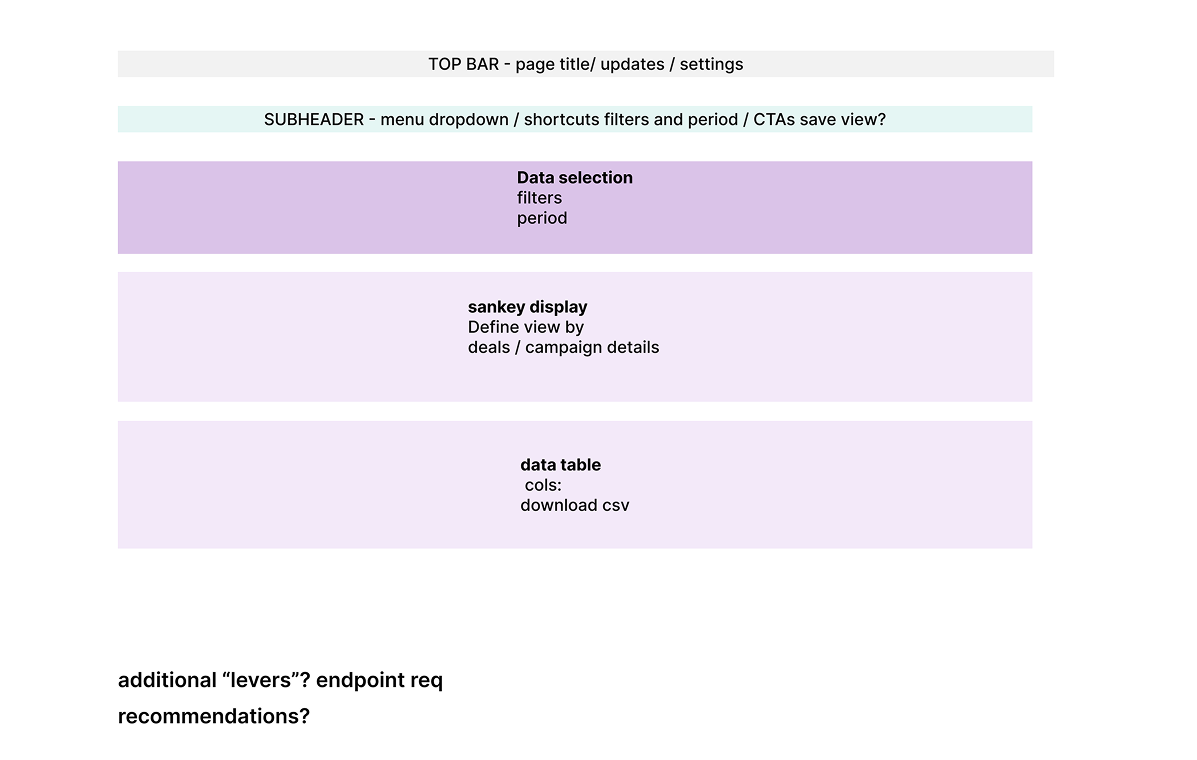
Solution
We designed a diagnostic interface that:
Aggregates key auction signals into a unified view
Highlights anomalies and potential failure points
Guides users through a structured investigation flow
Surfaces context needed to understand why something is happening
Tradeoffs
Depth vs. usability
We balanced exposing complex system behavior with keeping the interface understandableFlexibility vs. structure
Too much structure limits exploration; too little leads to confusionSpeed vs. completeness
Prioritized faster directional insights over exhaustive analysis
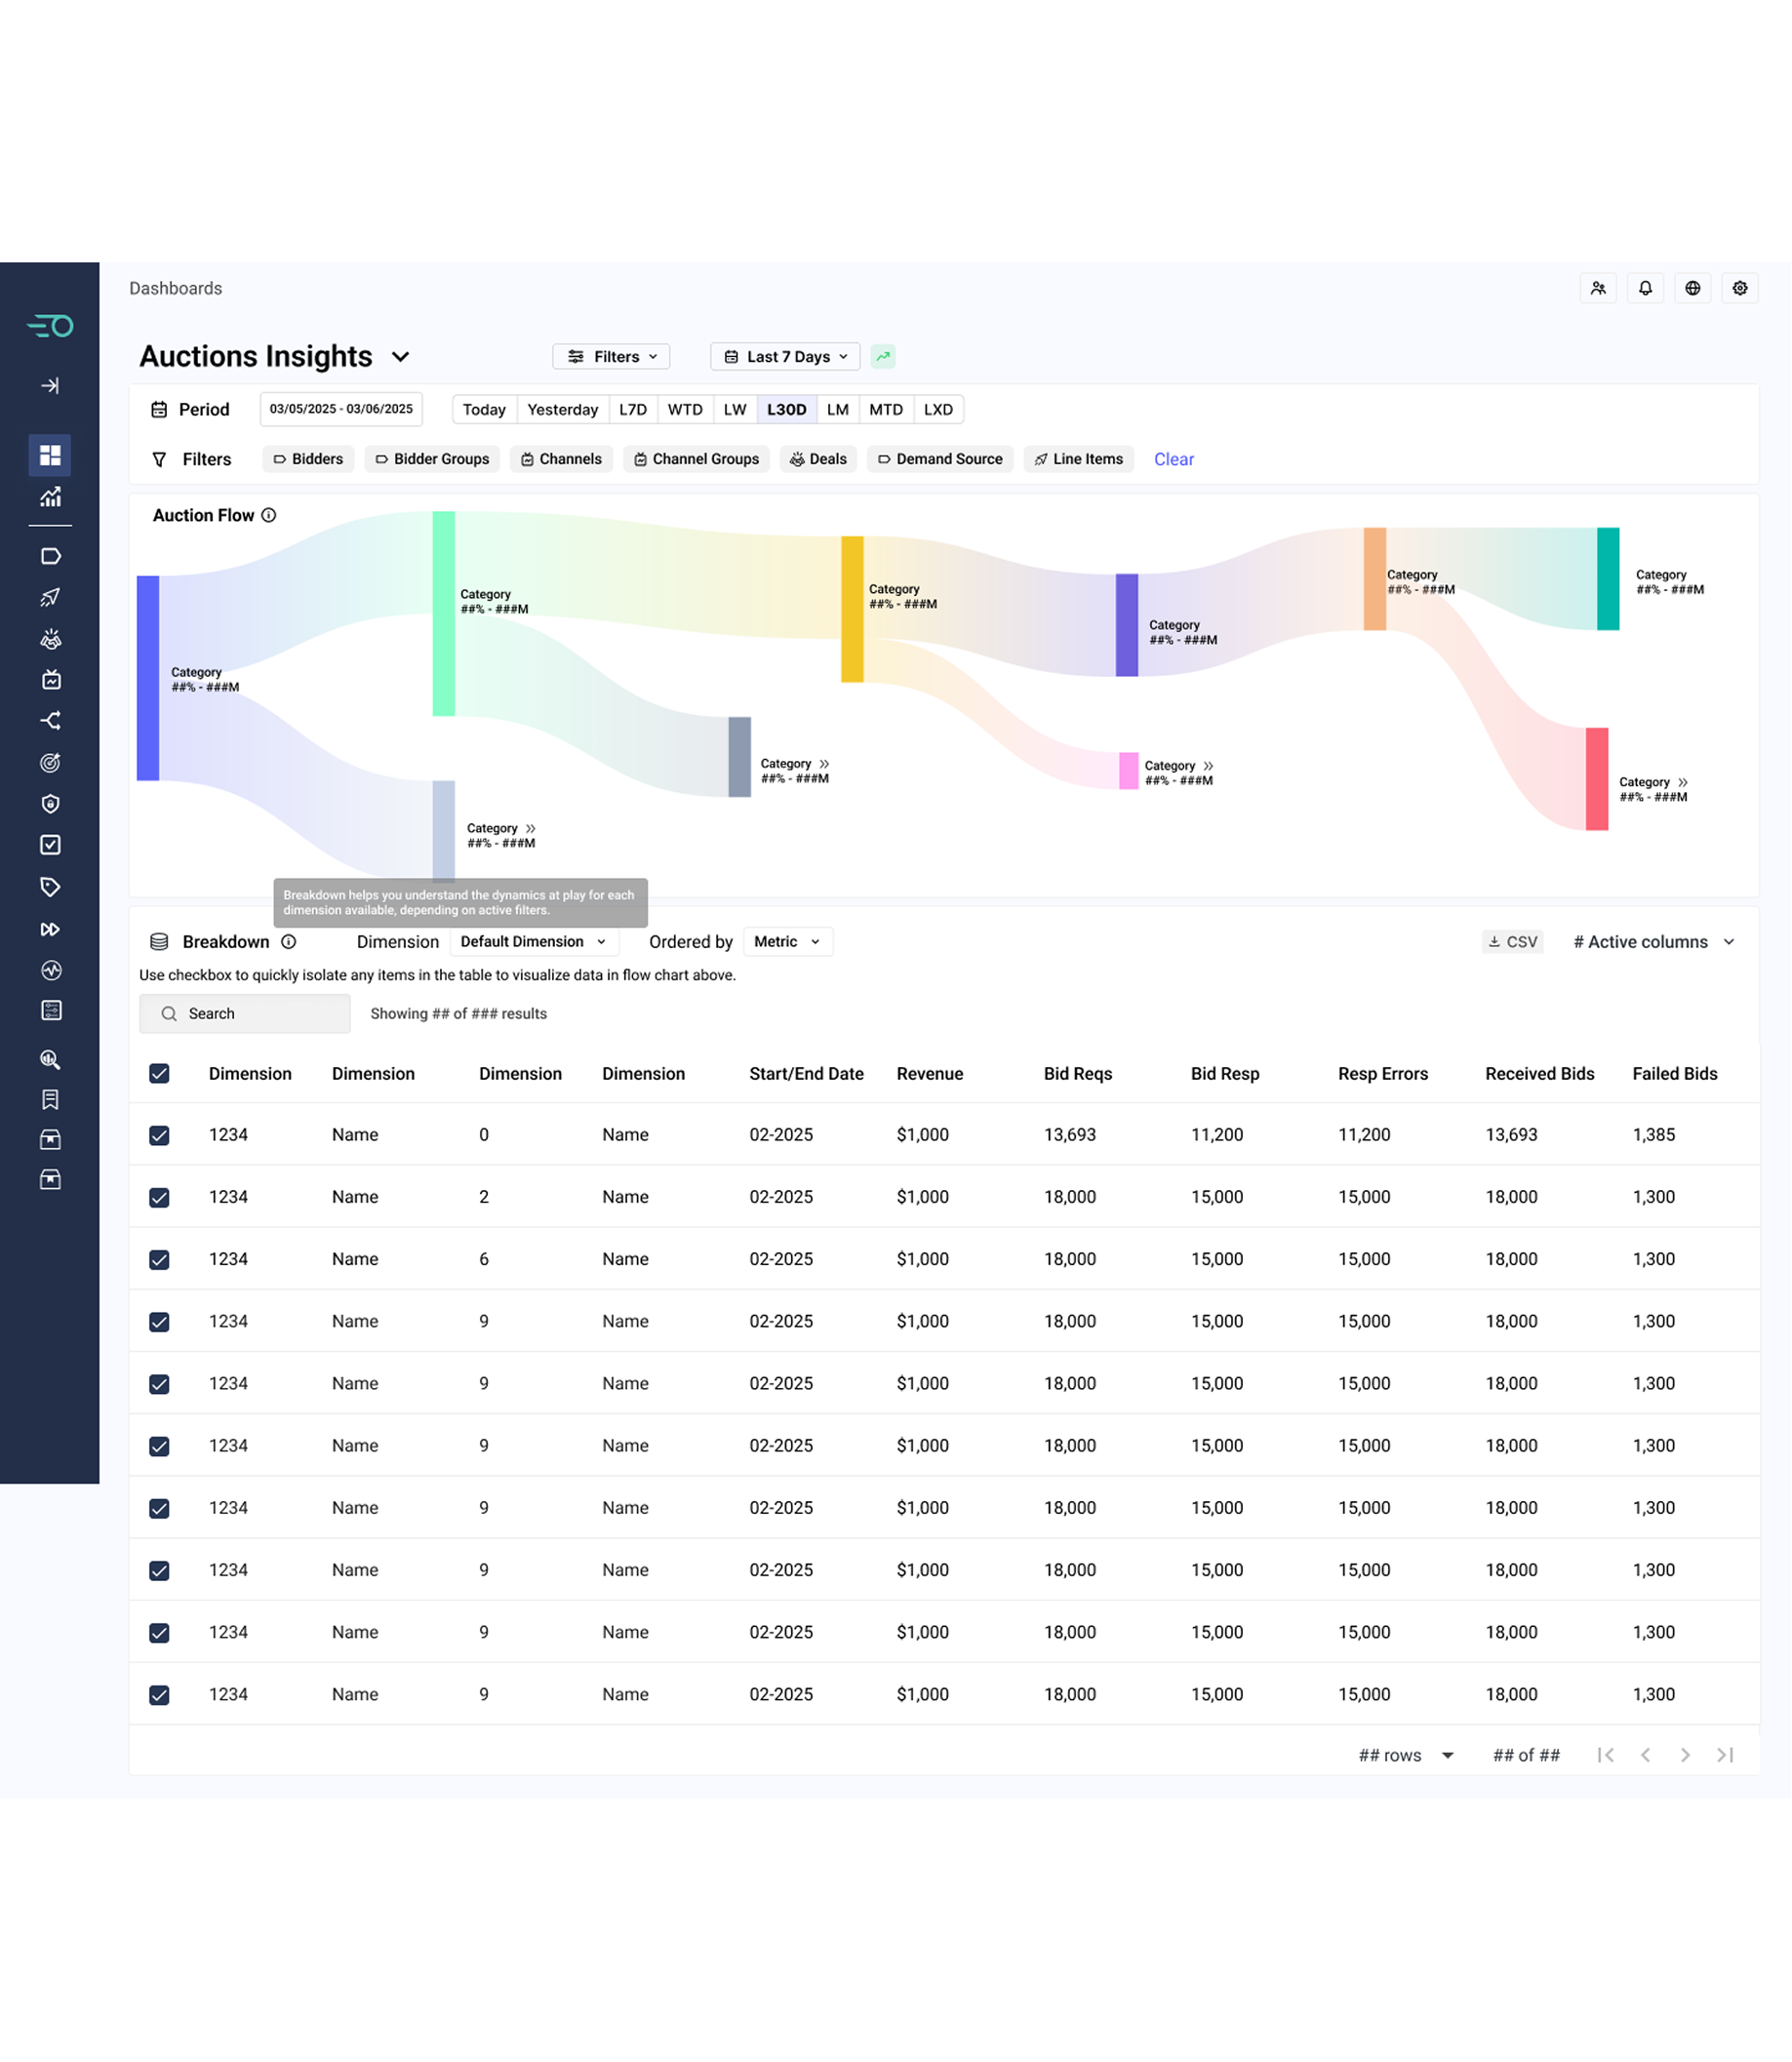
Outcome
The tool changed how teams approached diagnosing auction issues:
Investigations became faster and more structured
Teams aligned on a shared approach to problem-solving
Confidence in decision-making improved
Product impact
Beyond the feature itself:
Shifted the team from reactive debugging to more proactive monitoring
Influenced how future tools were designed around system transparency
Created a foundation for scaling diagnostic capabilities
What I’d do next
Introduce proactive alerts based on emerging patterns
Improve explainability of system-driven recommendations
Expand support for cross-system investigation